
If you’ve been running a WooCommerce store for more than a year, you’ve probably experienced at least one of these scenarios: a product goes out of stock on a Friday afternoon and you don’t notice until Monday. A supplier delivers late and you’re left with a gap in your catalog right during your peak week. Or the opposite — you over-ordered last season and you’re still sitting on pallets that are collecting dust and bleeding your cash flow month after month.
These aren’t operational details you can afford to ignore. They are direct hits to your margin, your customer retention, and your working capital. The frustrating part is that most of these losses are completely preventable — they’re not the result of bad luck or impossible-to-predict demand spikes. They’re the result of managing inventory with tools that weren’t designed for the job.
This article breaks down exactly what poor inventory management costs a WooCommerce store, why the default setup falls short, and what a smarter system actually looks like in practice.
According to a report by IHL Group, inventory distortion — the combined cost of stockouts and overstocks — cost retailers $1.77 trillion in 2023, equivalent to 7.2% of all retail sales. For a store doing €500,000 a year, that’s potentially €36,000 in preventable losses. Every year.
The Two-Headed Problem: Stockouts and Overstocking
Most store owners think of inventory management as a single problem: “don’t run out of stock.” But there are actually two failure modes, both equally damaging — and they pull in opposite directions. Fix one too aggressively and you create the other. That tension is exactly why inventory management is hard, and why gut feel doesn’t scale.
Stockouts: The Visible Damage
A stockout is the most obvious failure. A customer wants to buy. Your product shows “out of stock.” They leave. The sale is gone. But what most store owners don’t fully account for is what happens next — because the damage extends well beyond that single transaction.
Research shows that 69% of online shoppers will abandon their purchase entirely and shop with a competitor when items are unavailable. Not pause. Not wait. Leave — and go spend their money somewhere else. For a customer who’s never bought from you before, that might be the last time they ever consider your store. For a returning customer, it’s a signal that you’re not reliable.
Studies indicate that 40% of customers who experience a stockout will complete their entire purchase elsewhere rather than simply substituting the missing item. And that churn compounds: each stockout experience reduces return visit probability by approximately 9%. Three stockouts on the same customer and you’ve likely lost them permanently.
The financial math gets worse when you factor in paid traffic. If you’re running Google Shopping or Meta ads, you’ve been paying for clicks to a product that couldn’t convert. Every euro you spent sending traffic to an out-of-stock SKU was burned. And depending on your ad platform, those campaigns may have kept running for days before you even noticed the product was gone.
A single stockout event typically costs 1.5x to 3x the direct lost revenue once you factor in customer lifetime value loss, ranking damage, and emergency restock fees. — Nventory.io, 2026
There’s also an SEO dimension that’s easy to overlook. A stockout that leads to removing or hiding a product page creates a ranking gap that can take weeks to recover. Research from 8fig analyzing 524 products from 169 sellers found that 53% of Shopify products experienced at least one stockout per year, lasting an average of 35 days. That’s over a month of lost sales on more than half of a typical catalog.
Overstocking: The Silent Cash Flow Drain
Overstocking is less visible than a stockout, but financially just as destructive — because the damage doesn’t appear in your sales dashboard. It shows up on your balance sheet, in your bank account balance, and eventually in your ability to invest in growth.
When you’re overstocked, your cash isn’t gone — it’s just locked. Locked in a pallet you can’t sell this month. Locked in a product line that turned out to be slower than expected. Locked in seasonal inventory that missed its window and is now sitting at a price you can’t afford to discount without wiping out your margin.
Inventory carrying costs represent 12–35% of total inventory value per year. For a store holding €100,000 in stock, that’s €12,000–€35,000 per year just to keep it. That figure includes storage, insurance, obsolescence risk, and the opportunity cost of capital that could have been deployed elsewhere — in marketing, in new product development, or in a supplier deposit to secure better pricing on fast movers.
Low inventory turnover often results in 30% depreciation in product value over time. What you bought at €40 wholesale may need to be clearanced at €28 six months later. And sometimes you can’t even move it at that price without heavy promotion that costs you additional margin on top.
Why This Keeps Happening: The Root Cause
Most WooCommerce store owners don’t have a discipline problem. They have a data problem. Inventory decisions are hard to get right when you’re working without visibility into the numbers that actually drive them — and the default WooCommerce setup gives you almost none of that visibility.
Here’s what a typical inventory workflow looks like for a store managing 100–300 SKUs without dedicated tooling: you check stock levels manually, either by visiting product pages in WP Admin or by exporting to a spreadsheet. You have a rough sense of which products move fast. You reorder when something is running low — or worse, when it’s already out. You have a spreadsheet with supplier contacts and approximate lead times, but it’s not always current. When a stockout happens, you notice it because a customer emails you, or because you happen to look at the right page on the right day.
That process works when you have 20 SKUs and one supplier. At 200 SKUs with 4 suppliers, different lead times, seasonal demand patterns, and promotional spikes, it breaks down — and the losses start compounding in ways that are hard to even see clearly from inside the operation.
73% of retailers report difficulty predicting demand accurately. And 70–90% of stockouts are caused by poor replenishment practices — not supplier failures. Most stockouts are an internal process problem, not a supply chain problem.
The WooCommerce default inventory toolset reflects this limitation. You get a stock quantity field, a low-stock threshold, and a backorder setting. There is no sales velocity tracking. No reorder point calculation. No supplier lead time input. No prediction of when you’ll hit zero based on current sales pace. No view of which products are sitting still and costing you carrying fees. Most store owners compensate with intuition, spreadsheets, and reactive ordering — a combination that works until it doesn’t.
The Multi-Supplier Problem
If your catalog involves more than one supplier — and most stores above 50 SKUs do — inventory management gets significantly harder. Different suppliers have different lead times, different minimum order quantities, different reliability profiles, and sometimes different prices depending on order volume.
If you’re treating all suppliers with the same reorder logic, you’re making errors by design. A supplier who delivers in 3 days and a supplier who takes 4 weeks require completely different reorder points for the same sales velocity. If you set your reorder trigger at “5 units remaining” for both, you’ll be fine with the fast supplier and chronically out of stock with the slow one.
Multi-supplier management also introduces a cash flow timing problem. When you order from multiple suppliers on different cycles, payment obligations don’t always align with incoming revenue. A large order placed today to cover the next 6 weeks may need to be paid 30 days before the sales revenue from that stock arrives in your account. Managing this well requires knowing, for each product, which supplier you’re ordering from, their actual lead time, and your current sales velocity. Doing that manually across 200+ SKUs is a full-time job.
Seasonal Demand and Replenishment Forecasting
Seasonal demand is one of the most predictable challenges in e-commerce — and one of the most commonly mismanaged. The pattern is always the same: Q4 spikes, summer slows, promotions create artificial peaks, and product-specific seasonality adds another layer of complexity on top of all of that.
The problem with managing seasonality manually is that your memory is unreliable at scale. You might remember that last November was strong, but do you remember which specific SKUs drove the growth, by how much, and with what lead time relative to your order date? Probably not — and even if you did, applying that accurately to ordering decisions requires calculation that’s easy to get wrong under time pressure.
Good forecasting for a WooCommerce store doesn’t require machine learning or a €500/month SaaS platform. It requires three things: historical sales data at the SKU level, a way to apply seasonal adjustments to reorder quantities, and a system that surfaces the numbers before it’s too late to act on them. Companies using demand forecasting tools experience a 10–15% reduction in their overall inventory levels while maintaining or improving availability — fewer stockouts, less cash tied up, better margins on both sides.
For stores heading into a peak period, that 10–15% improvement in inventory efficiency can mean the difference between a peak season that generates cash and one that creates a working capital crisis from over-ordering into a demand spike you weren’t quite prepared for.
What a Smarter Replenishment System Looks Like
This is the StoknGo replenishment dashboard — a prioritized view of every SKU, with reorder quantities, sales velocity, stockout countdown, margin and supplier info all in one place, directly inside WP Admin:
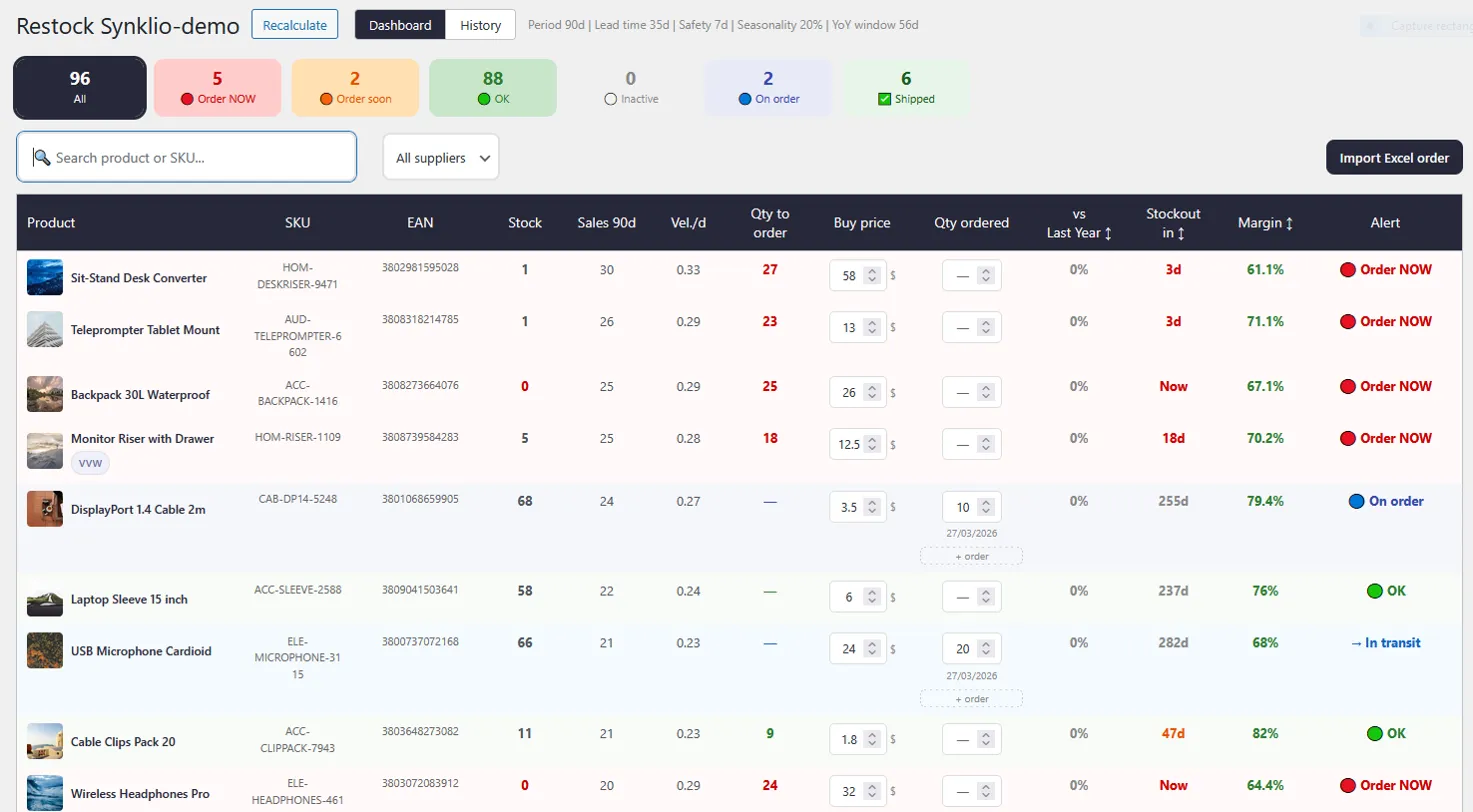
At a glance: 5 products need to be ordered immediately, 2 are approaching their threshold, and 88 are fine. The “Stockout in” column tells you exactly how many days remain before each SKU hits zero — based on actual sales velocity, not a static threshold set months ago. The “Vel./d” column shows current daily sales rate. The margin column lets you prioritize high-value SKUs. Compare that to manually checking each product in WooCommerce, calculating velocity by hand, and cross-referencing a supplier spreadsheet. The dashboard replaces that entire process with a 5-minute morning review.
What StoknGo Adds to WooCommerce
Ready to fix your inventory management?
Start replenishing smarter with StoknGo
Smart stock replenishment for WooCommerce. Know exactly what to reorder, when, and in what quantity — directly in WP Admin.
The Numbers: What Fixing This Is Actually Worth
Let’s be concrete. If your WooCommerce store does €300,000 in annual revenue and you’re experiencing typical inventory management inefficiencies — which, based on industry data, most stores are — here’s what the improvement potential looks like:
Estimated impact on a €300k/year WooCommerce store
For a store running 35% gross margins, recovering €15,600 in revenue from avoided stockouts translates to roughly €5,460 in additional gross profit. On top of that, a 10–15% reduction in inventory levels on an €80,000 stock position frees up €8,000–€12,000 in working capital — money you can reinvest, or simply not have to worry about financing during a slow month.
Getting Started: What to Do This Week
If you’re managing inventory manually today, here’s a practical starting point that doesn’t require any new tooling to begin — just a few hours of audit work that will change how you see your operation:
The Bottom Line
Inventory management isn’t glamorous. It doesn’t show up in your marketing metrics, your conversion rate dashboard, or your social analytics. But it shows up everywhere else — in your cash flow, your customer retention rate, the efficiency of your ad spend, and ultimately in your margins.
The stores that run the tightest operations aren’t necessarily the ones with the best products or the largest marketing budgets. They’re the ones that know what they have, what they’re going to need, when they need to order it, and what’s sitting still costing them money. That knowledge doesn’t come from gut feel and a spreadsheet at scale. It comes from a system.
Poor inventory management causes businesses to lose up to 11% of their annual revenue through inefficiency, waste, and missed opportunities. For most WooCommerce stores, closing that gap doesn’t require an enterprise ERP or a 6-month implementation. It requires better data, better alerts, and a tool that lives where you already work — inside WP Admin.
That’s exactly what StoknGo is built to do.